The ILO Report on Education and Employment - A Worrying Picture
No Jobs / Poor Jobs:
The ILO Report on Education and Employment
A Worrying Picture
- Akash Bhattacharya
The India Employment Report 2024 released by the Institute for Human Development and International Labour Organization on March 26, presented a gloomy picture of the Indian economy. The report has flagged concerns about poor employment conditions: the slow transition to non-farm employment has reversed; women largely account for the increase in self-employment and unpaid family work; youth employment is of poorer quality than employment for adults; wages and earnings are stagnant or declining.
The report uses the ‘employment condition index’ to understand the economy. The index is based on seven labour market outcome indicators: (i) percentage of workers employed in regular formal work; (ii) percentage of casual labourers; (iii) percentage of self-employed workers below the poverty line; (iv) work participation rate; (v) average monthly earnings of casual labourers; (vi) unemployment rate of secondary and above-educated youth; (vii) youth not in employment and education or training.
The report has focused on almost two decades : 2000 to 2022. The report brutally exposes the current government’s claim of having ensured all-round development and generated millions of jobs.
Employment Quality
Informal employment has risen — around half the jobs in the formal sector are of an informal nature. Self-employment and unpaid family work has also increased, especially for women. Almost 82% of the workforce is engaged in the informal sector, and nearly 90% is informally employed, the report said. Self-employment remains the primary source of employment — 55.8% in 2022. Casual and regular employment accounted for 22.7% and 21.5% respectively.
The share of self-employment remained almost stable around 52% between 2000 and 2019, while regular employment increased by almost 10 percentage points, to 23.8% from 14.2%. This is reversed by 2022, with self-employment increasing to 55.8%, while the share of regular employment declined to 21.5%. Casual employment consistently declined to 22.7% in 2022 from 33.3% in 2000.
Participation of Women
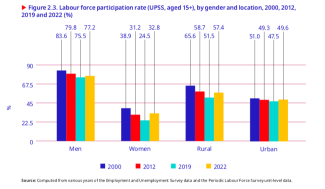
The female labour force participation rate (LFPR) in India remains among the world’s lowest. Female LFPR declined by 14.4 percentage points (compared to 8.1 percentage points for males) between 2000 and 2019. The trend reversed thereafter with female LFPR rising by 8.3 percentage points (compared to 1.7 percentage points for male LFPR) between 2019 and 2022.
There is a considerable gender gap — women’s LFPR (32.8%) in 2022 was 2.3 times lower than men’s (77.2%). India’s low LFPR is largely attributed to the low female LFPR, which was much lower than the world average of 47.3% in 2022, but higher than the South Asian average of 24.8%, as per ILO data.
As on 2022, 48.4% women are not in employment, education, or training. This is nearly five times that of men (9.8%).
Structural Transformation
There has been a reversal of the slow transition towards non-farm employment after 2018-19. The share of agriculture in total employment fell to around 42% in 2019 from 60% in 2000.
This shift was largely absorbed by construction and services, the share of which in total employment increased to 32% in 2019 from 23% in 2000. The share of manufacturing in employment has remained almost stagnant at 12-14%.
However, since 2018-19, this slow transition has stagnated or reversed with the rise in the share of agricultural employment.
Youth Employment
Youth employment and underemployment increased between 2000 and 2019 but declined during the pandemic years. However, unemployment among youths, especially those with secondary-level or higher education, has intensified over time.
In 2022, the share of unemployed youths in the total unemployed population was 82.9%. The share of educated youths among all unemployed people also increased to 65.7% in 2022 from 54.2% in 2000.
The unemployment rate among youths was six times greater for those who had completed secondary education or higher (18.4%) and nine times higher for graduates (29.1%) than for persons who could not read or write (3.4%) in 2022. This was higher among educated young women (21.4%) than men (17.5%), especially among female graduates (34.5%), compared to men (26.4%).
The unemployment rate among educated youths grew to 30.8% in 2019 from 23.9% in 2000, but fell to 18.4% in 2022. Even though there has been a rise in youth employment recently, the quality of work remains a concern, especially for qualified young workers.
Forty percent of technically qualified youth engaged in vocations which do not correspond to their qualifications. Highly skilled youth are taking up blue collar jobs. At an aggregate level only 4% of youth have access to formal vocational training. In 2005, only 11.61% of youth had access to vocational training. That increased to a mere 15.62% in 2022. Among them only 3.6% were OBCs, 3.66% were SCs, and 1.79% STs. The education-employment gap gives a lie to the government’s claim of having bridged this gap through the National Education Policy (NEP 2020).
The Lies of the Present Government
Employment grew at only 1.6% annually between 2000 and 2012. After 2012, it declined to 0.01%. It increased after 2019, but mainly in agriculture. The share of manufacturing in employment was stagnant throughout the Modi years, at around 12% to 14% per year. This indicates the failure of Make in India and other flagship employment generation schemes. During these years, employment in manufacturing increased by only 1.7% annually (2000 to 2019) and then by 3.5% between 2019 and 2022. This is a far cry from the government’s claim of generating lakhs of manufacturing jobs every year.
Two-thirds of incremental employment after 2019 comprised self-employed workers, among whom unpaid women family workers predominate. Nearly 82% of the workforce engages in the informal sector, and nearly 90% is informally employed. A large number of youths are employed in the gig and platform economy where jobs are insecure, poorly paid and the labor regime is very oppressive and controlled by algorithmic functions.
As much as 62% of the unskilled agriculture workers and 70% of such workers in the construction sector at the all-India level did not receive the prescribed minimum wage in 2022. A large proportion of regular workers (40.8%) and casual workers (51.9%) did not receive the average daily minimum wage prescribed for unskilled workers.
All this is proof of low-quality employment, characterized by poor wages, job insecurity, lack of social security and workplace rights. The way the report draws attention not only to unemployment but also to the poor quality of employment makes it highly significant. While unemployment is a potent issue in Indian politics, the quality of employment still remains somewhat as a hidden problem.
The report is praiseworthy, but it could have reflected more on the possible impact of labour codes on employment. The ‘employment condition index’ could have been conceptualized better. Workers’ rights as well as their access to basic civic amenities need to be accepted as a key indicator of the quality of employment. The report stops short of doing that. Reports such as these will also benefit from consulting workers’ unions as key stakeholders in the economy.